Norm ecg in adults
What is an electrocardiogram, most of us know for sure. But which of the non-specialists can decipher the ECG: indicators, norms, conclusions, of course, only a doctor can give. However, the patient is sometimes interested in what the ECG should be in order to independently check the state of his body. In this article, we will pay more attention to such a concept as the ECG norm in adults, which differs markedly from the norm for children.
General concepts about ECG data
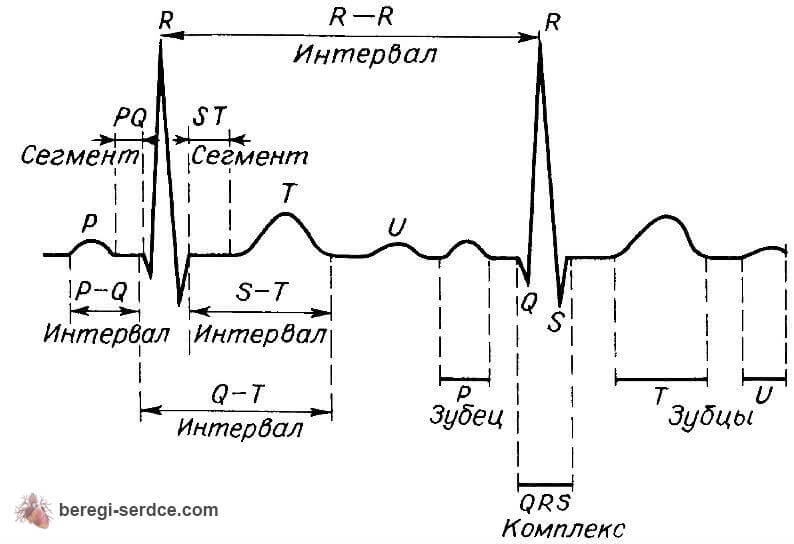
For those who want to know how to decipher the ECG on their own, first of all, let's say: data on the work of the myocardium are reflected on the electrocardiogram and look like alternating teeth and flatter intervals and segments. The teeth located on the isoelectric line resemble a curve with up and down taps. They are denoted by the letters P, R, S, Q, T and are written between the T and P waves at rest with a line of a horizontal segment. When deciphering the ECG of the heart, a norm is carried out between TP or TQ, which determines the width, intervals and amplitude of fluctuations in the length of the teeth.
Indicators of a normal cardiogram
Knowing how to decipher the ECG of the heart, it is important to interpret the result of the research, adhering to a certain sequence. You need to pay attention first to:
- myocardial rhythm.
- electrical axis.
- Conductivity intervals.
- T wave and ST segments.
- Analysis of QRS complexes.
Deciphering the ECG in order to determine the norm is reduced to the data of the position of the teeth. The ECG norm in adults in terms of heart rate is determined by the duration of the R-R intervals, i.e. the distance between the highest teeth. The difference between them should not exceed 10%. A slow rhythm indicates bradycardia, and a rapid one indicates tachycardia. The rate of pulsations is 60-80.
According to the P-QRS-T intervals located between the teeth, the passage of the impulse through the cardiac departments is judged. As the results of the ECG will show, the norm of the interval is 3-5 squares or 120-200 ms.
In the ECG data, the PQ interval reflects the penetration of the biopotential to the ventricles through the ventricular node directly to the atrium.
The QRS complex on the ECG shows ventricular excitation. To determine it, you need to measure the width of the complex between the Q and S waves. A width of 60-100 ms is considered normal.
The norm when deciphering the ECG of the heart is the severity of the Q wave, which should not be deeper than 3 mm and less than 0.04 in duration.
The QT interval indicates the duration of the ventricular contraction. The norm here is 390-450 ms, a longer interval indicates ischemia, myocarditis, atherosclerosis or rheumatism, and a shorter interval indicates hypercalcemia.
When deciphering the ECG norm, the electrical axis of the myocardium will show the areas of impulse conduction disturbance, the results of which are calculated automatically. To do this, the height of the teeth is monitored:
- The S wave should normally not exceed the R wave.
- With a deviation to the right in the first lead, when the S wave is lower than the R wave, this indicates that there are deviations in the work of the right ventricle.
- The reverse deviation to the left (the S wave exceeds the R wave) indicates left ventricular hypertrophy.
The QRS complex will tell about the passage through the myocardium and the septum of the biopotential. A normal ECG of the heart will be in the case when the Q wave is either absent or does not exceed 20-40 ms in width, and a third of the R wave in depth.
The ST segment should be measured between the end of the S and the beginning of the T wave. Its duration is affected by the pulse rate. Based on the results of the ECG, the norm of the segment takes place in such cases: ST depression on the ECG with acceptable deviations from the isoline of 0.5 mm and a rise in leads of no more than 1 mm.
reading teeth
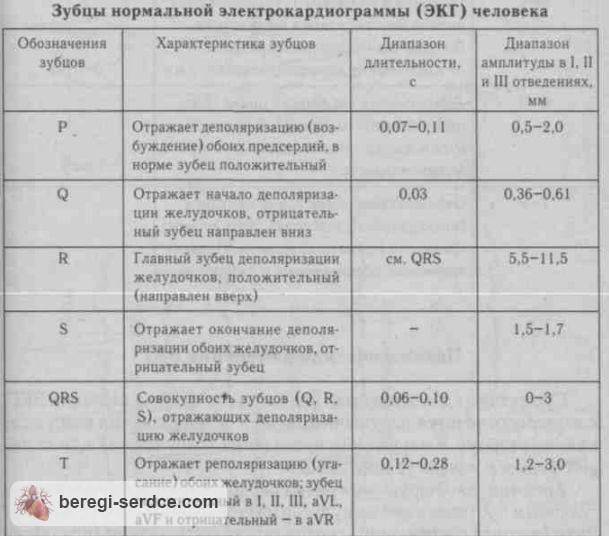
- The P wave is normally positive in leads I and II, and negative in VR at a width of 120 ms. It shows how the biopotential is distributed throughout the atria. Negative T in I and II indicates signs of ventricular hypertrophy, ischemia, or infarction.
- The Q wave reflects the excitation of the left side of the septum. Its norm: a quarter of the R wave and 0.3 s. Exceeding the norm indicates a necrotic pathology of the heart.
- The R wave shows the activity of the walls of the ventricles. Normally, it is fixed in all leads, and a different picture speaks of ventricular hypertrophy.
- The S wave on the ECG shows excitation of the basal layers and ventricular septa. Normally, it is 20 mm. It is important to pay attention to the ST segment, which determines the state of the myocardium. If the position of the segment fluctuates, then this indicates myocardial ischemia.
- The T wave in leads I and II is directed upwards, and in VR leads it is only negative. A change in the T wave on the ECG indicates the following: a high and sharp T indicates hyperkalemia, and a long and flat T wave indicates hypokalemia.
Why can ECG readings vary in the same patient?
A patient's ECG data can sometimes differ, so if you know how to read a heart ECG but see different results in the same patient, don't make a premature diagnosis. Accurate results will require consideration of various factors:
- Often distortions are caused by technical defects, for example, inaccurate gluing of the cardiogram.
- The confusion can be caused by Roman numerals, which are the same in the normal and inverted directions.
- Sometimes problems result from cutting the chart and missing the first P wave or the last T.
- Preliminary preparation for the procedure is also important.
- Appliances operating nearby affect the alternating current in the network, and this is reflected in the repetition of the teeth.
- The instability of the baseline can be affected by the uncomfortable position or excitement of the patient during the session.
- Sometimes there is a displacement or incorrect location of the electrodes.
Therefore, the most accurate measurements are obtained on a multichannel electrocardiograph.
It is on them that you can check your knowledge of how to decipher an ECG on your own, without fear of making a mistake in making a diagnosis (treatment, of course, can only be prescribed by a doctor).