Electrocardiography (ECG): fundamentals of theory, removal, analysis, detection of pathologies
Electrocardiography (ECG): fundamentals of theory, removal, analysis, detection of pathologies
Applied for practical purposes in the 70s of the 19th century by the Englishman A. Waller, an apparatus that records the electrical activity of the heart continues to faithfully serve humanity to this day. Of course, for almost 150 years it has undergone numerous changes and improvements, but the principle of its work, based on records of electrical impulses propagating in the heart muscle, remained the same.
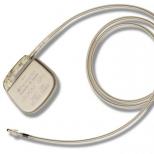
Now almost every ambulance team is equipped with a portable, lightweight and mobile electrocardiograph, which allows you to quickly take an ECG, not lose precious minutes, diagnose and promptly deliver the patient to the hospital. For large-focal myocardial infarction, and other diseases that require emergency measures, minutes count, so an urgent electrocardiogram saves more than one life every day.
Deciphering the ECG for the doctor of the cardiology team is a common thing, and if it indicates the presence of an acute cardiovascular pathology, then the team immediately, turning on the siren, goes to the hospital, where, bypassing the emergency room, they will take the patient to the intensive care unit for urgent care. The diagnosis with the help of an ECG has already been made and no time has been lost.
Patients want to know...
Yes, patients want to know what the incomprehensible teeth on the tape left by the recorder mean, therefore, before going to the doctor, patients want to decipher the ECG themselves. However, everything is not so simple, and in order to understand the “tricky” record, you need to know what a human “motor” is.
The heart of mammals, which includes humans, consists of 4 chambers: two atria, endowed with auxiliary functions and having relatively thin walls, and two ventricles, which carry the main load. The left and right parts of the heart also differ from each other. Providing blood to the pulmonary circulation is less difficult for the right ventricle than pushing blood into the systemic circulation with the left. Therefore, the left ventricle is more developed, but also suffers more. However, regardless of the difference, both parts of the heart should work evenly and harmoniously.

The heart is heterogeneous in its structure and electrical activity, since contractile elements (myocardium) and irreducible elements (nerves, blood vessels, valves, fatty tissue) differ in varying degrees of electrical response.
Usually patients, especially older ones, are worried: are there any signs of myocardial infarction on the ECG, which is quite understandable. However, for this you need to learn more about the heart and the cardiogram. And we will try to provide this opportunity by talking about waves, intervals and leads and, of course, about some common heart diseases.
Ability of the heart
For the first time, we learn about the specific functions of the heart from school textbooks, so we imagine that the heart has:
- automatism, due to the spontaneous generation of impulses, which then cause its excitation;
- excitability or the ability of the heart to activate under the influence of exciting impulses;
- or the “ability” of the heart to ensure the conduction of impulses from their place of origin to contractile structures;
- Contractility, that is, the ability of the heart muscle to carry out contractions and relaxation under the control of impulses;
- tonicity, in which the heart in diastole does not lose its shape and provides continuous cyclic activity.
In general, the heart muscle in a calm state (static polarization) is electrically neutral, and biocurrents(electrical processes) in it are formed under the influence of exciting impulses.
Biocurrents in the heart can be recorded
Electrical processes in the heart are due to the movement of sodium ions (Na +), which are initially located outside the myocardial cell, inside it and the movement of potassium ions (K +), rushing from the inside of the cell to the outside. This movement creates conditions for changes in transmembrane potentials during the entire cardiac cycle and repeated depolarizations(excitation, then contraction) and repolarizations(transition to the original state). All myocardial cells have electrical activity, but slow spontaneous depolarization is characteristic only of the cells of the conduction system, which is why they are capable of automatism.
 Excitation propagated through conducting system, sequentially covers the departments of the heart. Starting in the sinoatrial (sinus) node (the wall of the right atrium), which has maximum automatism, the impulse passes through the atrial muscles, the atrioventricular node, the bundle of His with its legs and goes to the ventricles, while exciting the sections of the conduction system even before the manifestation of its own automatism .
The excitation that occurs on the outer surface of the myocardium leaves this part electronegative in relation to the areas that the excitation has not touched. However, due to the fact that the tissues of the body have electrical conductivity, biocurrents are projected onto the surface of the body and can be registered and recorded on a moving tape in the form of a curve - an electrocardiogram. The ECG consists of teeth that are repeated after each heartbeat, and through them shows those violations that are in the human heart.
How is an EKG taken?
Many people can probably answer this question. Making an ECG, if necessary, is also not difficult - there is an electrocardiograph in every clinic. EKG technique? It only seems at first glance that she is so familiar to everyone, but meanwhile, only health workers who have received special training in taking an electrocardiogram know her. But it is hardly worthwhile for us to go into details, since no one will allow us to do such work without preparation anyway.

Patients need to know how to properly prepare: that is, it is advisable not to overeat, do not smoke, do not consume alcoholic beverages and drugs, do not get involved in heavy physical labor and do not drink coffee before the procedure, otherwise you can deceive the ECG. It will certainly be provided, if not something else.
So, a completely calm patient undresses to the waist, frees his legs and lies down on the couch, and the nurse will lubricate the necessary places (leads) with a special solution, apply electrodes, from which wires of different colors go to the device, and take a cardiogram.
The doctor will then decipher it, but if you are interested, you can try to figure out your own teeth and intervals on your own.
Teeth, leads, intervals
Perhaps this section will not be of interest to everyone, then it can be skipped, but for those who are trying to figure out their ECG on their own, it may be useful.
The teeth in the ECG are indicated using Latin letters: P, Q, R, S, T, U, where each of them reflects the state of different parts of the heart:
- P - atrial depolarization;
- QRS complex - depolarization of the ventricles;
- T - repolarization of the ventricles;
- A small U wave may indicate repolarization of the distal ventricular conduction system.

To record an ECG, as a rule, 12 leads are used:
- 3 standard - I, II, III;
- 3 reinforced unipolar limb leads (according to Goldberger);
- 6 reinforced unipolar chest (according to Wilson).
In some cases (arrhythmias, abnormal location of the heart), it becomes necessary to use additional unipolar chest and bipolar leads and according to Nebu (D, A, I).

When deciphering the results of the ECG, the duration of the intervals between its components is measured. This calculation is necessary to assess the frequency of the rhythm, where the shape and size of the teeth in different leads will be an indicator of the nature of the rhythm, the electrical phenomena occurring in the heart and (to some extent) the electrical activity of individual sections of the myocardium, that is, the electrocardiogram shows how our heart works in that or other period.
Video: lesson on ECG waves, segments and intervals
ECG analysis
A more rigorous interpretation of the ECG is carried out by analyzing and calculating the area of \u200b\u200bthe teeth using special leads (vector theory), however, in practice, they generally manage with such an indicator as electrical axis direction, which is the total QRS vector. It is clear that each chest is arranged in its own way and the heart does not have such a strict location, the weight ratio of the ventricles and the conductivity inside them are also different for everyone, therefore, when decoding, the horizontal or vertical direction of this vector is indicated.
Doctors analyze the ECG in sequential order, determining the norm and violations:
- Assess the heart rate and measure the heart rate (with a normal ECG - sinus rhythm, heart rate - from 60 to 80 beats per minute);
- Intervals are calculated (QT, the norm is 390-450 ms), characterizing the duration of the contraction phase (systole) using a special formula (more often I use the Bazett formula). If this interval is lengthened, then the doctor has the right to suspect,. And hypercalcemia, on the contrary, leads to a shortening of the QT interval. The pulse conductivity reflected by the intervals is calculated using a computer program, which significantly increases the reliability of the results;
- they begin to count from the isoline along the height of the teeth (normally R is always higher than S) and if S exceeds R, and the axis deviates to the right, then they think about violations of the right ventricle, if vice versa - to the left, and at the same time the height of S is greater than R in II and III leads - suspect left ventricular hypertrophy;
- The QRS complex is studied, which is formed during the conduction of electrical impulses to the ventricular muscle and determines the activity of the latter (the norm is the absence of a pathological Q wave, the width of the complex is not more than 120 ms). If this interval is displaced, then they speak of blockades (full and partial) of the legs of the His bundle or conduction disturbance. Moreover, incomplete blockade of the right leg of the His bundle is an electrocardiographic criterion for right ventricular hypertrophy, and incomplete blockade of the left leg of the His bundle may indicate left hypertrophy;
- The ST segments are described, which reflect the period of recovery of the initial state of the heart muscle after its complete depolarization (normally located on the isoline) and the T wave, which characterizes the process of repolarization of both ventricles, which is directed upwards, is asymmetric, its amplitude is below the wave in duration, it is longer than the QRS complex.
Only a doctor carries out the decoding work, however, some ambulance paramedics perfectly recognize a common pathology, which is very important in emergency cases. But first you still need to know the ECG norm.

This is how a cardiogram of a healthy person looks like, whose heart works rhythmically and correctly, but not everyone knows what this record means, which can change under various physiological conditions, such as pregnancy. In pregnant women, the heart occupies a different position in the chest, so the electrical axis shifts. In addition, depending on the period, the load on the heart is added. An ECG during pregnancy will reflect these changes.
The indicators of the cardiogram are also excellent in children, they will “grow” with the baby, therefore they will change according to age, only after 12 years the child’s electrocardiogram begins to approach the ECG of an adult.
Worst Diagnosis: Heart Attack

The most serious diagnosis on the ECG, of course, is, in the recognition of which the cardiogram plays the main role, because it is she (the first!) Finds the zones of necrosis, determines the localization and depth of the lesion, and can distinguish an acute infarction from the scars of the past.
The classic signs of myocardial infarction on the ECG are the registration of a deep Q wave (OS), segment elevationST, which deforms R, smoothing it, and the subsequent appearance of a negative pointed isosceles T wave. Such an elevation of the ST segment visually resembles a cat's back ("cat"). However, myocardial infarction is distinguished with and without a Q wave.

Video: signs of a heart attack on the ECG
When there's something wrong with the heart
Often in the conclusions of the ECG you can find the expression: "". As a rule, people whose heart has carried an additional load for a long time, for example, with obesity, have such a cardiogram. It is clear that the left ventricle in such situations is not easy. Then the electric axis deviates to the left, and S becomes greater than R.

hypertrophy of the left (left) and right (right) ventricles of the heart on the ECG
Video: cardiac hypertrophy on the ECG
related materials:
In questions about the interpretation of the ECG, be sure to indicate the gender, age, clinical data, diagnoses and complaints of the patient.